


La Tania Weather & Snow Forecasts
La Tania and Three Valleys Live Weather, Forecast & Snow Forecast
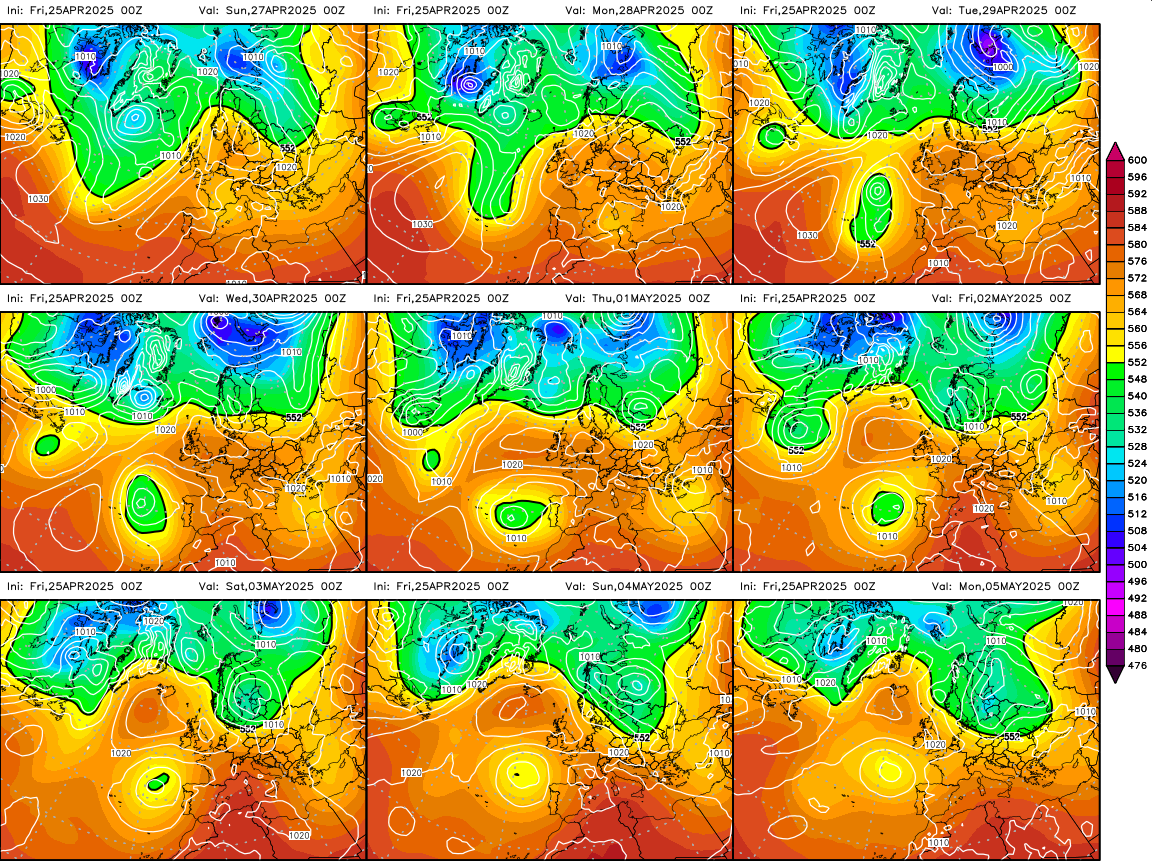
Detailed 3-Day Mountain Weather Forecast (in Winter)
PistePro
Météo France
Mobile Weather Link
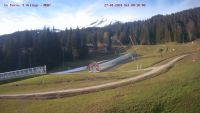
The Snow Watch - La Tania LIVE - WebCams and RoadCams

View detailed snow forecast for La Tania at:
snow-forecast.com